Chelsi Nakano
January 27, 2021
These days we use analytics to measure the performance of just about everything: websites, emails, social posts, etc. When it comes to our sales pitches, however, we’re mostly going in and coming out blind. By using Prezi Analytics, you can actually gain insight into your audience’s mind before and after the presentation, and use your findings to make your meetings more valuable for everyone.
Here are some ways you can use Prezi Analytics to boost your presentations:
1. Heat up cold leads
Cold emails are a key part of any good sales strategy, but understanding how people are interacting with the messaging can be tricky. By using Prezi Analytics, you’ll know which cold leads are actually interested in your offering and which sections are most interesting to them. This will not only tell you who’s worthy of a phone call, but also exactly what to address when you connect.
2. Put your leave-behinds to work
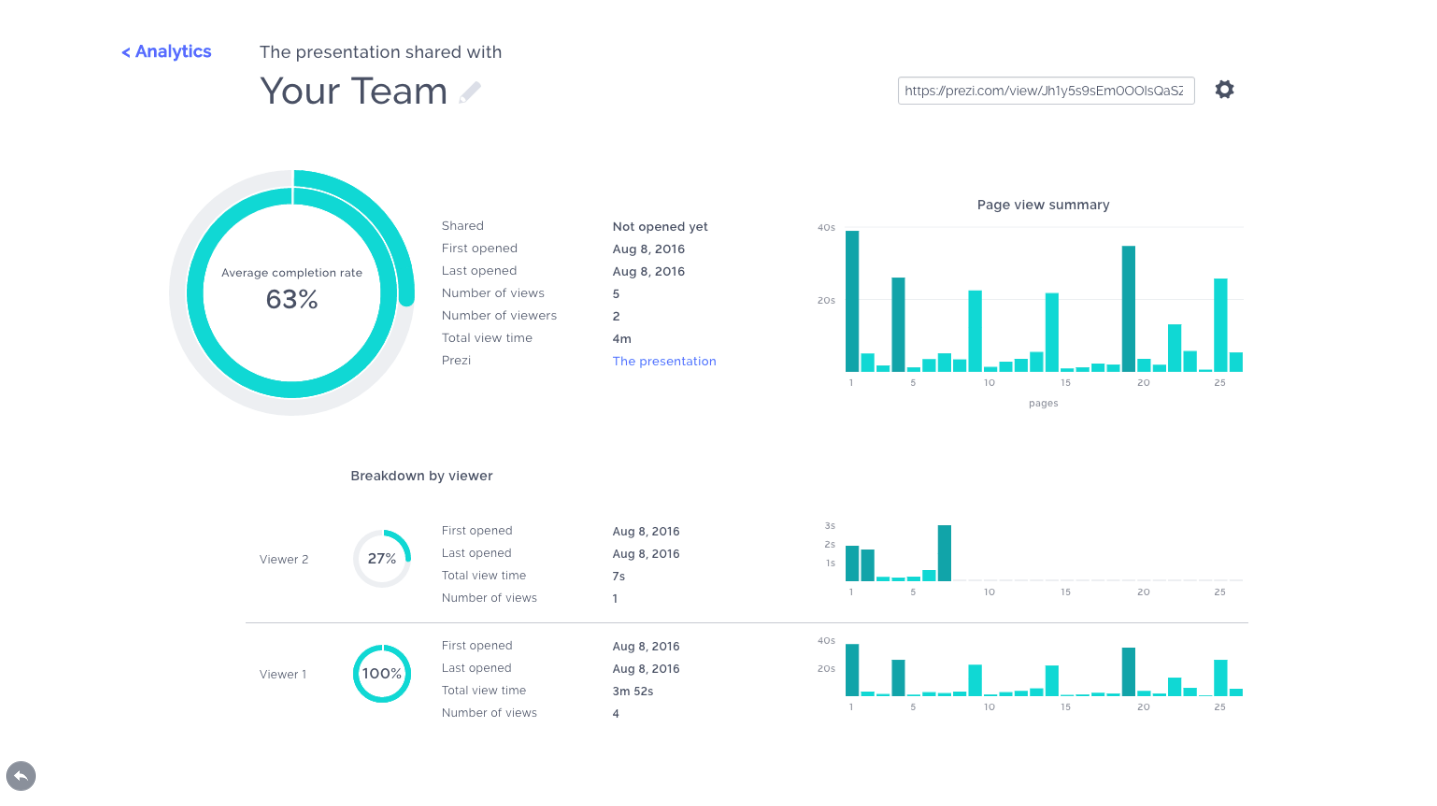
Prospects love leave-behind materials, but unless you’re a mind reader it’s difficult to know exactly how they’re using them. With Prezi Business, you can attach a tracking link to your presentation and use it to see which parts your audience is revisiting. With insight into the information they care about most, you’ll know how best to continue the conversation.
The additional perk of seeing if they shared your presentation with anyone else gives you a sense of how many internal stakeholders you might have to work with down the line.
3. Optimize content with A/B testing
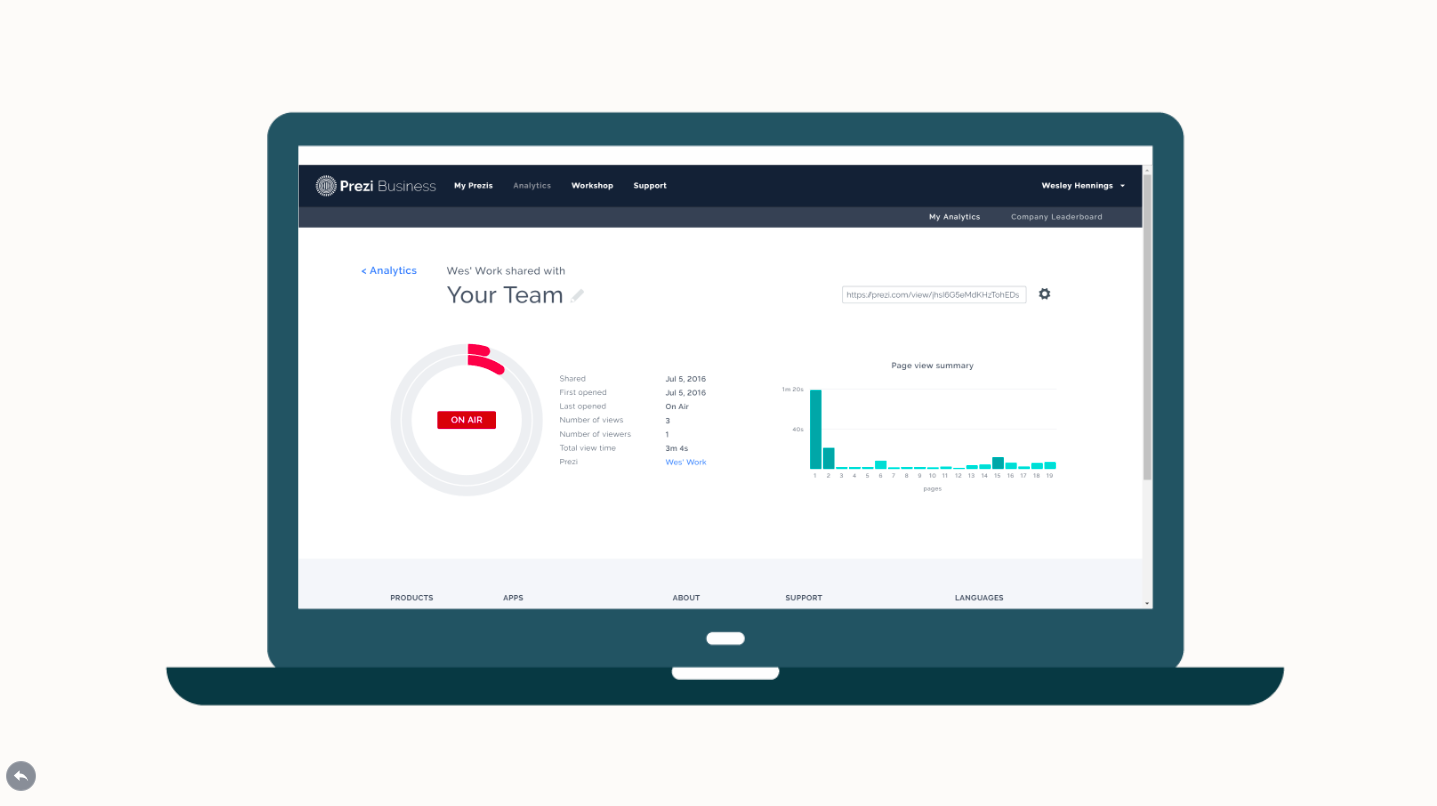
You can try to optimize your outbound messaging by creating two tracking links (one for each presentation that you’re testing) and then send each to a large audience. Once you’ve compiled your results, you’re ready to compare the open and completion rates across the two different pieces of content. Being able to see how much time people are spending on your different pieces of content, and how they’re engaging differently, can help you understand which version of your presentation garners more engagement from your audience.

Pro tip: The fewer variables, the better. Start small, try changing one thing about your presentation and see if the amount of time people are spending on that one section changes depending on the content.
4. Track team performance
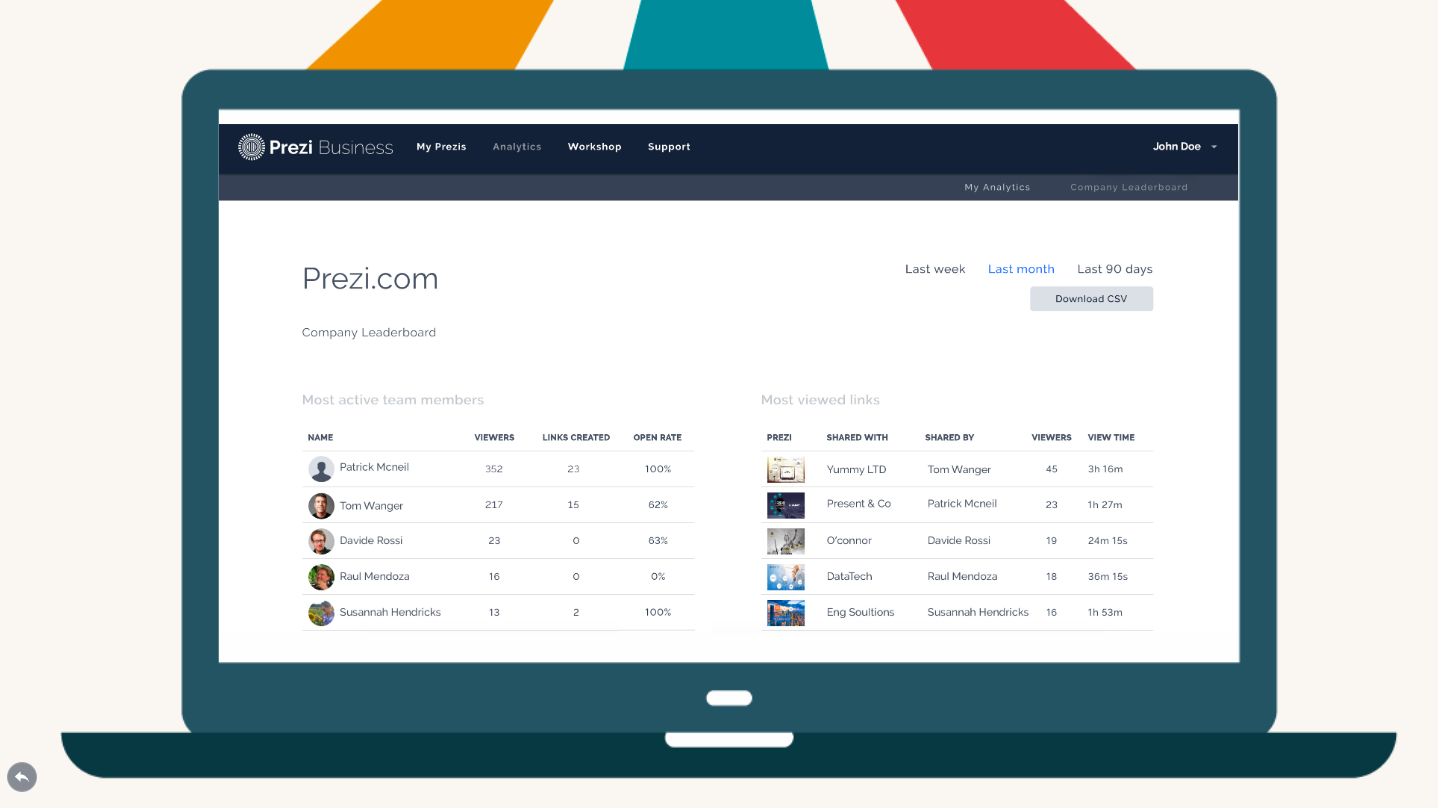
There is no “I” in team, but there is an “I” in “winner”. Use the Prezi Analytics leaderboard to track how all of your team members are performing against one another, such as who is getting the highest open rates, the highest completion rates, and the most engagement from viewers. These big picture metrics can help you to figure out who top performers are, and figure out what they’re doing differently—and how junior salespeople can become more like them.
Click here to learn about getting started with Prezi Analytics, or explore more in this reusable presentation.