Michael Lee
May 23, 2019
Chances are good that you’ve encountered a companion animal in your life (or at least read about some of the more interesting animals people try to bring on planes). And while most people can understand the benefit of companion animals, there are still controversies around emotional support animals and breeding options.
Non-profit organization Faunalytics needed to reach a broad audience and convey a lot of information without losing interest. To help visualize their data while still telling a compelling story, they turned to Infogram.
Using data effectively
With Infogram, Faunalytics was able to distill data into more compelling bite-sized pieces of content, starting with fun facts:

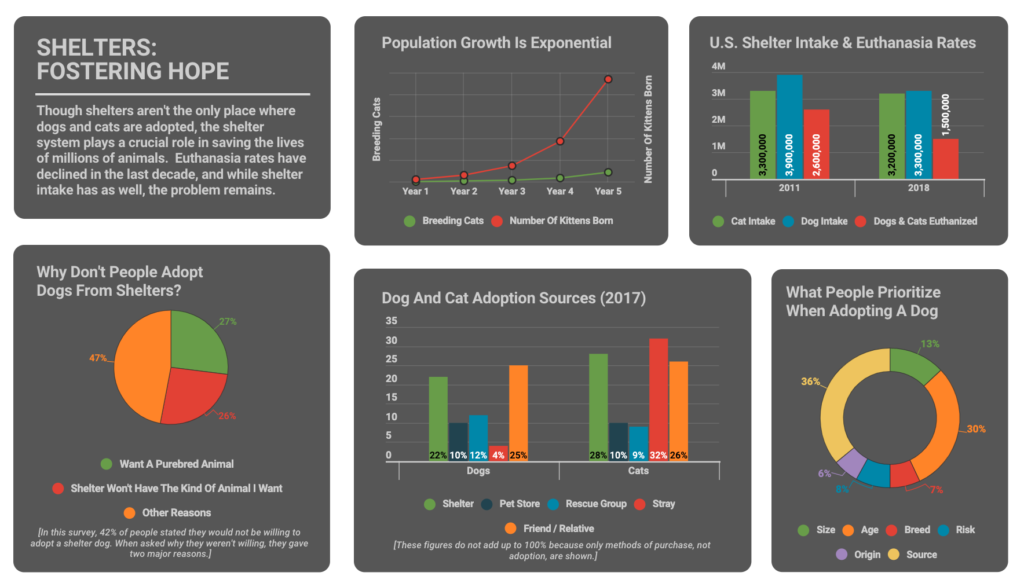
From there, they moved towards more important topics, such as attitudes towards companion animals and breeding vs. shelters. By laying out a range of color-coded charts within a dashboard format, Faunalytics could showcase related information while still inviting their audience to engage with the specific data they were interested in:
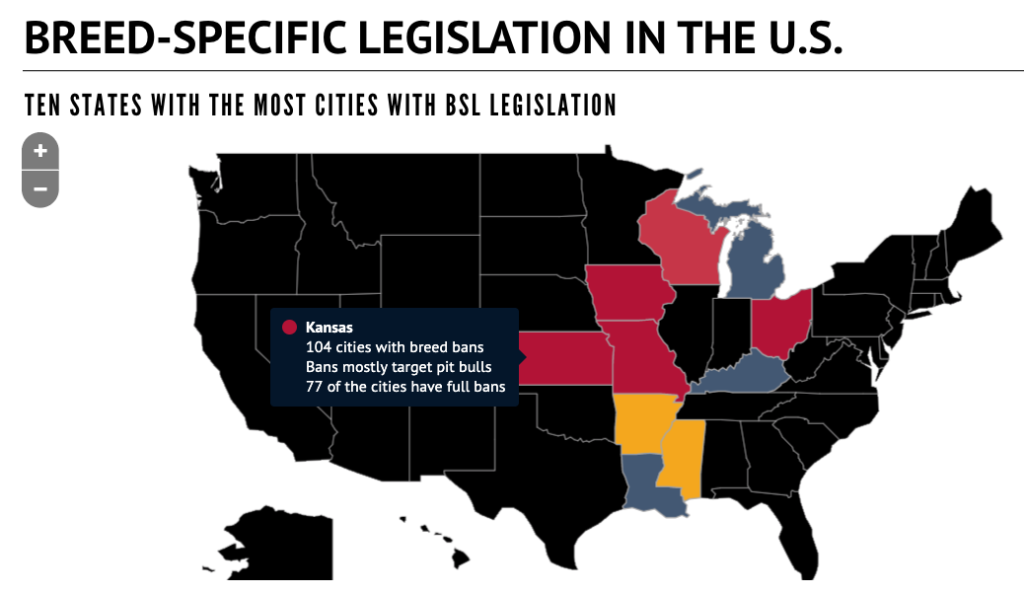
However, line, bar, and pie charts are not always enough to illustrate a point. In order to better discuss legislation on breed bans in the United States, Faunalytics used the maps available in Infogram to provide their data in an interactive format (including additional information when hovering over certain states):
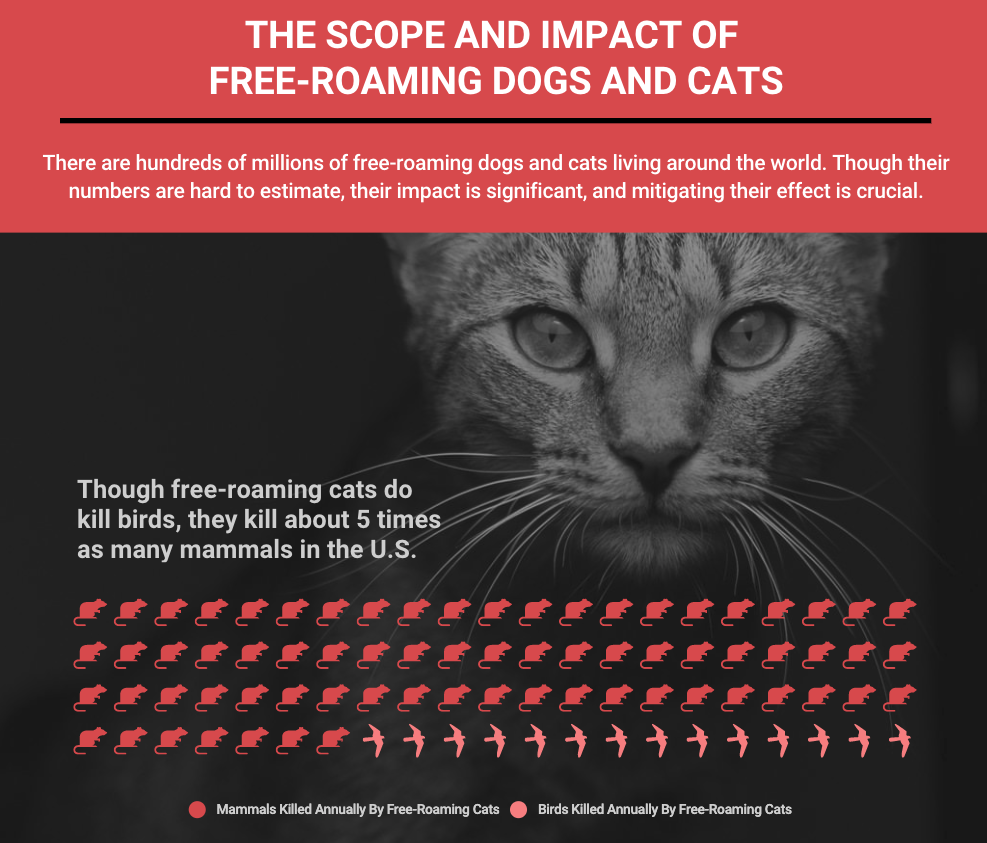
And when it came to showcasing the impact of free-roaming animals, they used a combination of imagery and icons to clearly make their point:
By using a variety of charts in interesting ways, Faunalytics was able to condense a large amount of information about companion animals into a easy-to-understand and engaging page. Click below to see the full piece (with more data), or try Infogram to tell your own data story today.