Anete Ezera
November 11, 2022
In today’s digital space, data holds more power than ever. Content matters when it performs well, and to understand performance you turn to analytics. Only with insightful data, can you start understanding your audience and the quality and relevancy of your content.
When you’ve spent hours crafting your infographic, report, dashboard, or other data visualization project, you’re much more invested in its performance after publication. With Prezi’s new Prezi Design analytics, you can finally unlock high-level information about who’s viewing and interacting with your projects and how engaged they really are with your content.
Note: To access Prezi Design Analytics, sign up for a Premium or higher Prezi plan. Simply upgrade your license and get access to this and other great features.
Track the performance of your Prezi Design projects
If you’re creating an infographic for an article or putting together a marketing report for your team, you want to know who saw those projects and interacted with them. Prezi Design Analytics gives you valuable insight into the performance of your projects and data visualizations, such as charts, graphs, maps, and more.
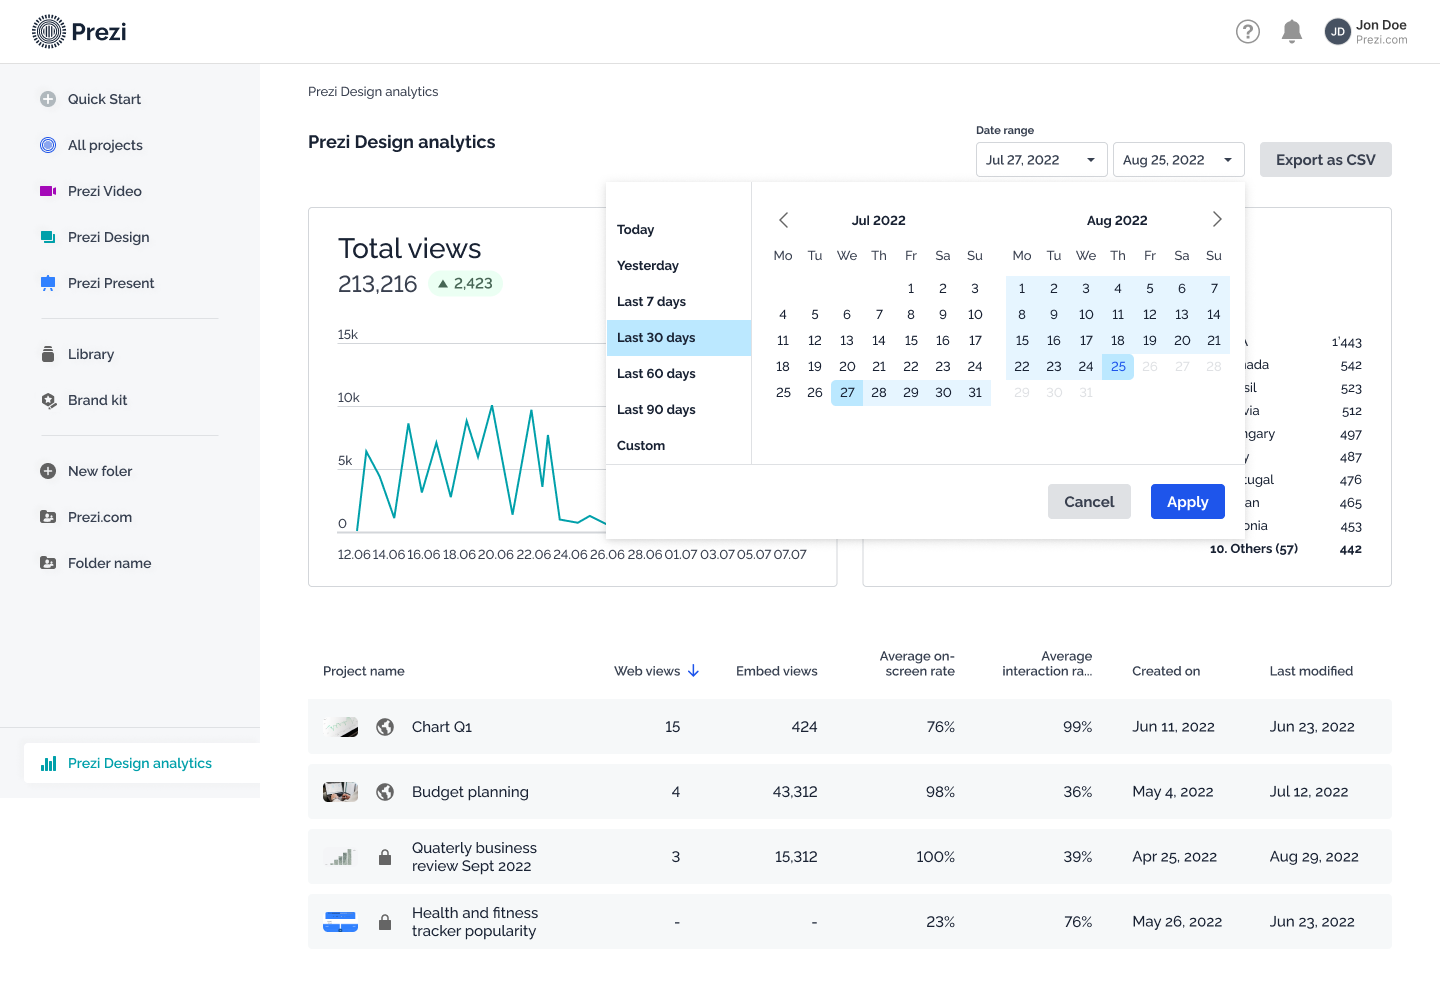
In your Prezi Design Analytics dashboard, you’ll see an overview of your project views and the locations where projects were viewed from. The viewer demographics are vital for understanding your audience. For example, if you see that your infographic is getting a lot of views from non-English-speaking countries, you might want to consider localizing your content.
In the dashboard, you’ll also see an overview of each project’s performance data, such as the number of webs and embed views, average on-screen time and interaction rates, and the dates the project was created and last modified.
Review project engagement with chart analytics
One of the most talked about and important indicators in today’s media landscape are engagement. Everyone wants their content to be engaging and catch interest. That’s why having the possibility to measure engagement is crucial.
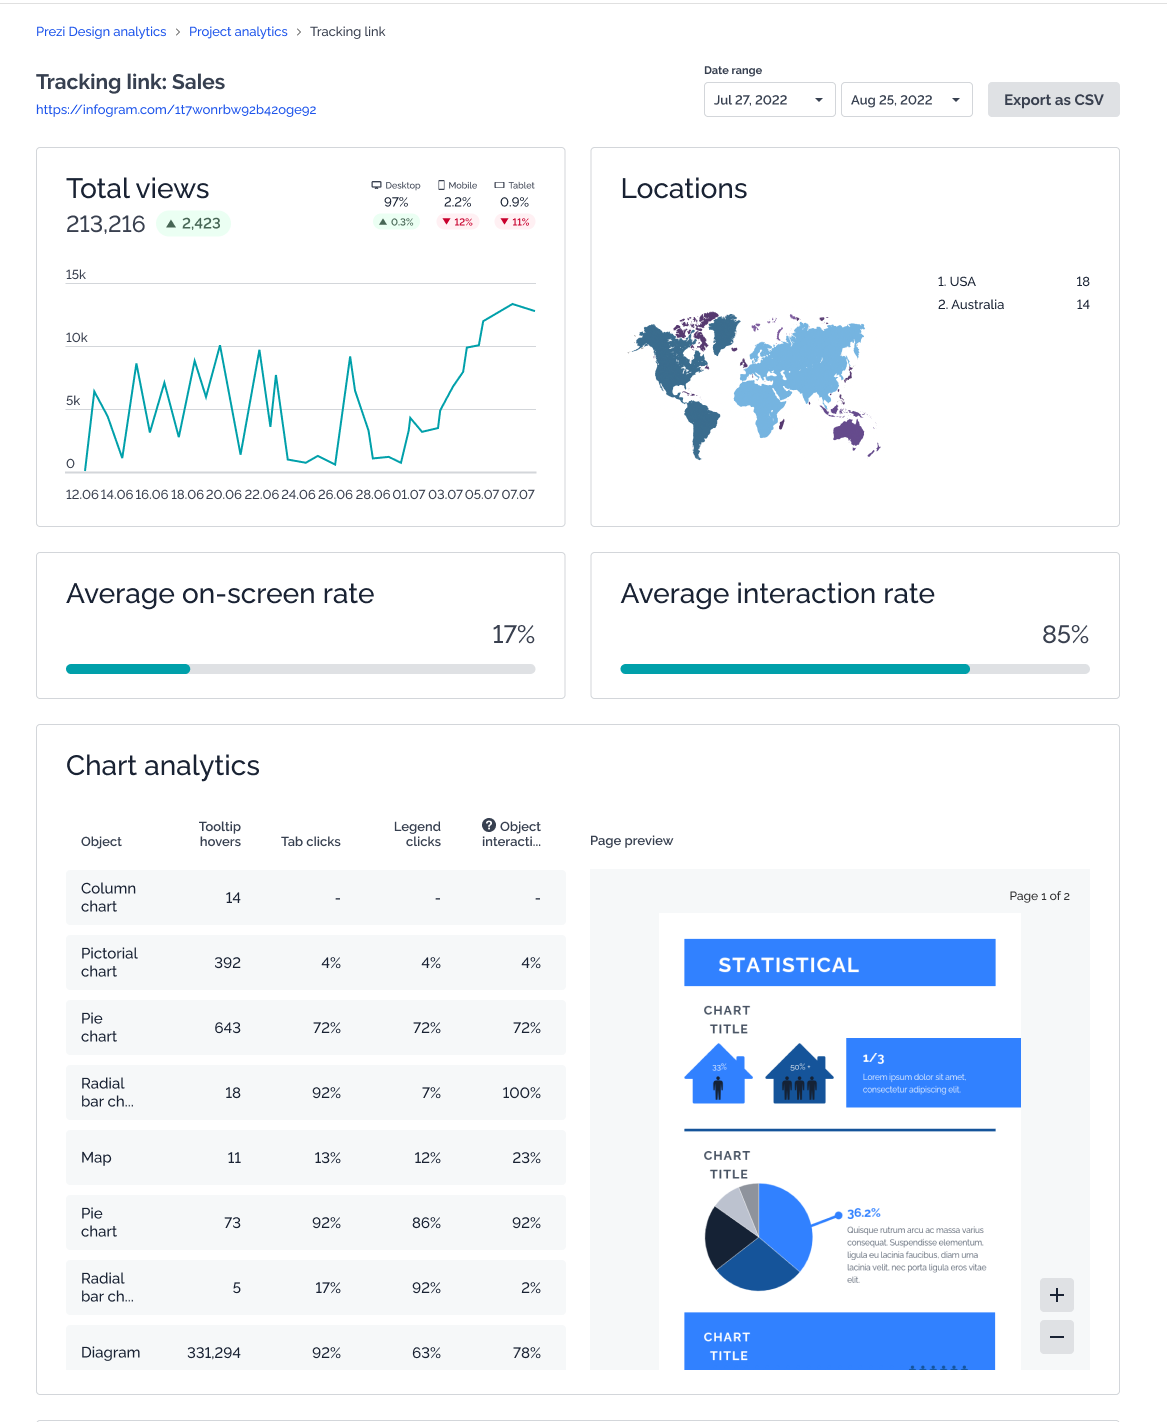
To take a closer look at engagement, view each project’s performance. There you’ll access location data, have an overview of average on-screen and interaction rates, and see a detailed breakdown of chart analytics.
Chart analytics provide you with an in-depth look at engagement and interaction. You can discover how many viewers clicked on your tabs, legends, or other objects or hovered over your project’s tooltips. You can track and analyze the viewer’s behavior when interacting with your design elements, which helps you improve future projects.
Get an overview of your presentation’s performance
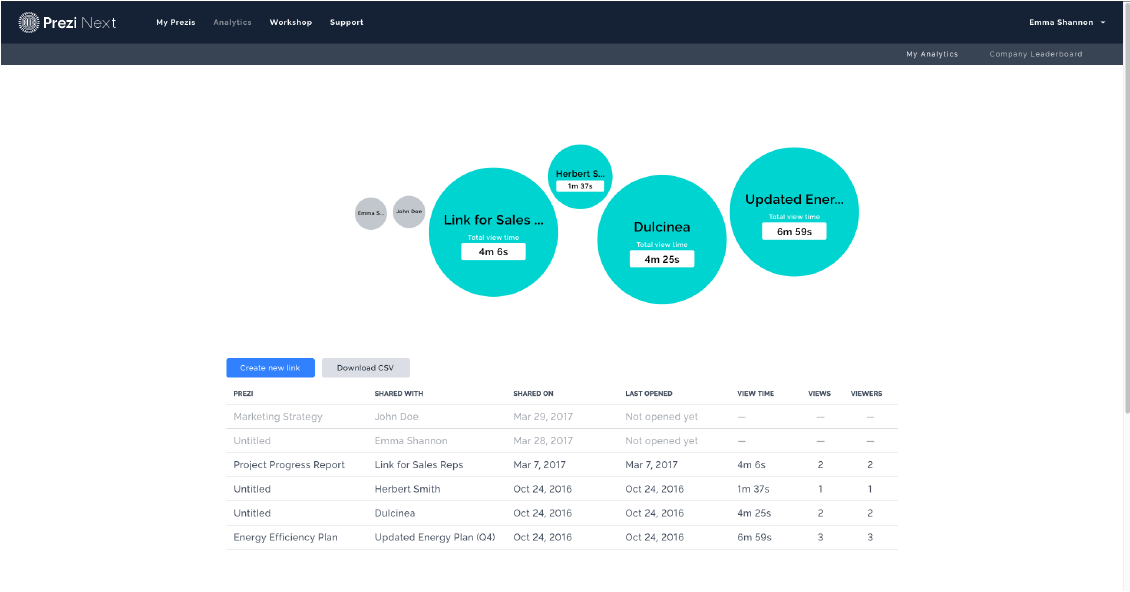
Alongside Prezi Design Analytics, you can also use Prezi Present Analytics to get an overview of the presentations you’ve published or shared. With Prezi Present Analytics, you get an overview of views, view time, and more.
You can go in-depth and review the performance of an individual presentation. You’ll find valuable metrics, such as the average completion rate and more on your page view summary. page view summary. Also, you can edit the reference name, hide the presentation from the company leaderboard, and so much more. Discover all the features and familiarize yourself better with Prezi Present analytics.
No matter what data visualizations you’re creating, Prezi is excited to help you improve and optimize the performance of your projects. With Prezi Design Analytics, you can measure the metrics that matter most to you, whether that’s views, audience demographics, engagement, or any other aspect vital to your business.
All you need to do is go to your Prezi Design dashboard, find analytics at the bottom left corner, and select the projects and timeline you want to view. Learn more in detail on how to use Prezi Design Analytics to get the full benefits of our newest feature!