Chelsi Nakano
August 23, 2016
Great content is a gift, but in the business world, great content + data is like a gift that keeps on giving. We recently combined the two in a feature of Prezi Business called Prezi Analytics. Now, you’re able to see when people are looking at your content, detailed information on presentation consumption, and a live leaderboard for tracking your teammates’ presentations.
Information like this can be super handy for a number of reasons, but here are our top 4.
1. Maximize Outbound Sales & Cold Emails
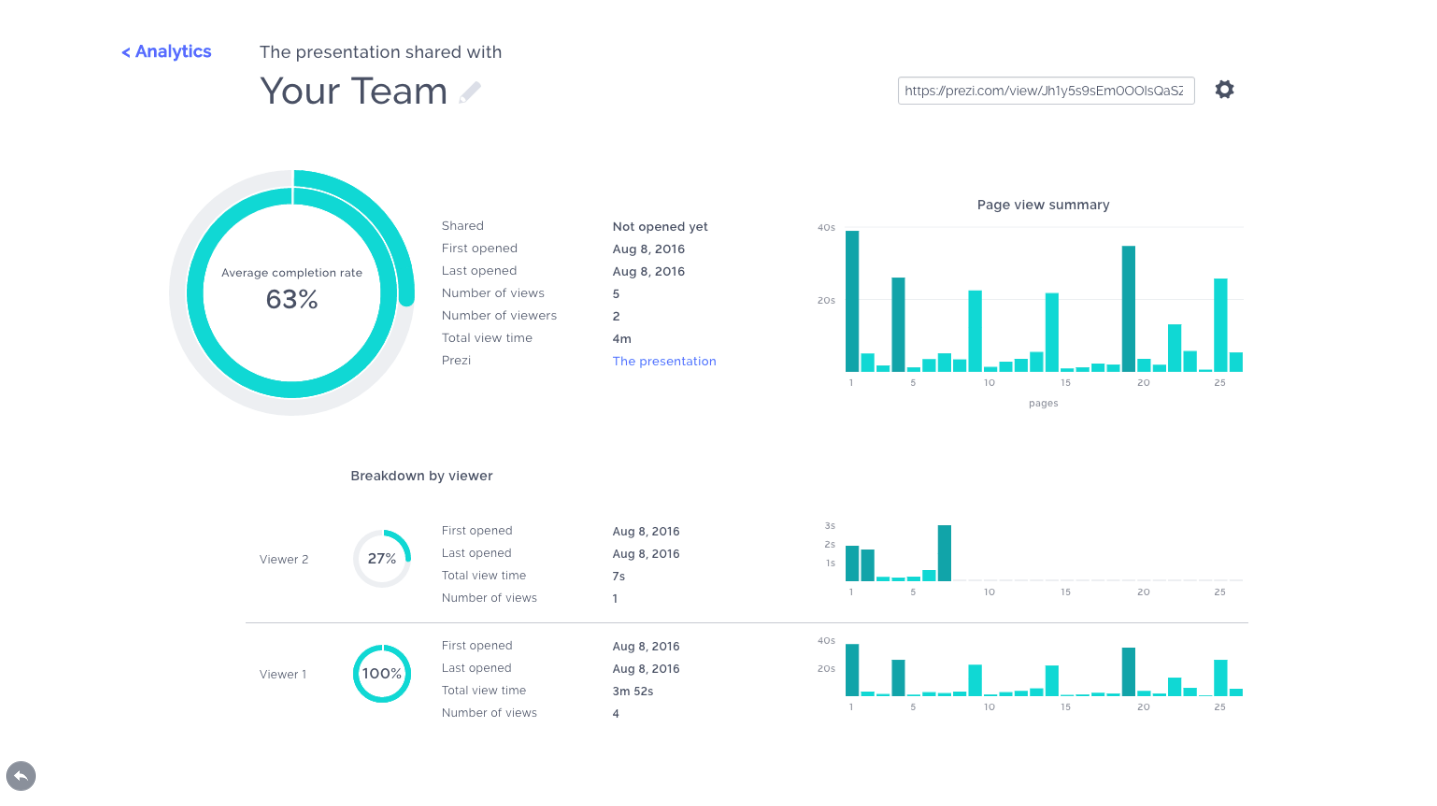
Cold emails are a key part of any good sales strategy, but understanding how people are interacting with the messaging can be tricky. Prezi Analytics provides real-time notifications which alert you to the moment your prospect views the content. By knowing exactly when it’s being checked out, you have a better idea of when to follow up. And as far as what to say, we’ve got you covered there too: the feature offers detailed information about which parts of the prezi are being viewed the most. Now, you can know when your content is being looked at, how often, and what about it is most interesting.
2. Get the Most Out of Follow-Ups & Leave-Behinds
So let’s say the sales meeting went really well, and you want to share your deck as a leave-behind; just create a tracking link! Use the link to see which parts of your presentation might have been the most intriguing, or the most confusing, and get insights on what your prospect might want more information on.
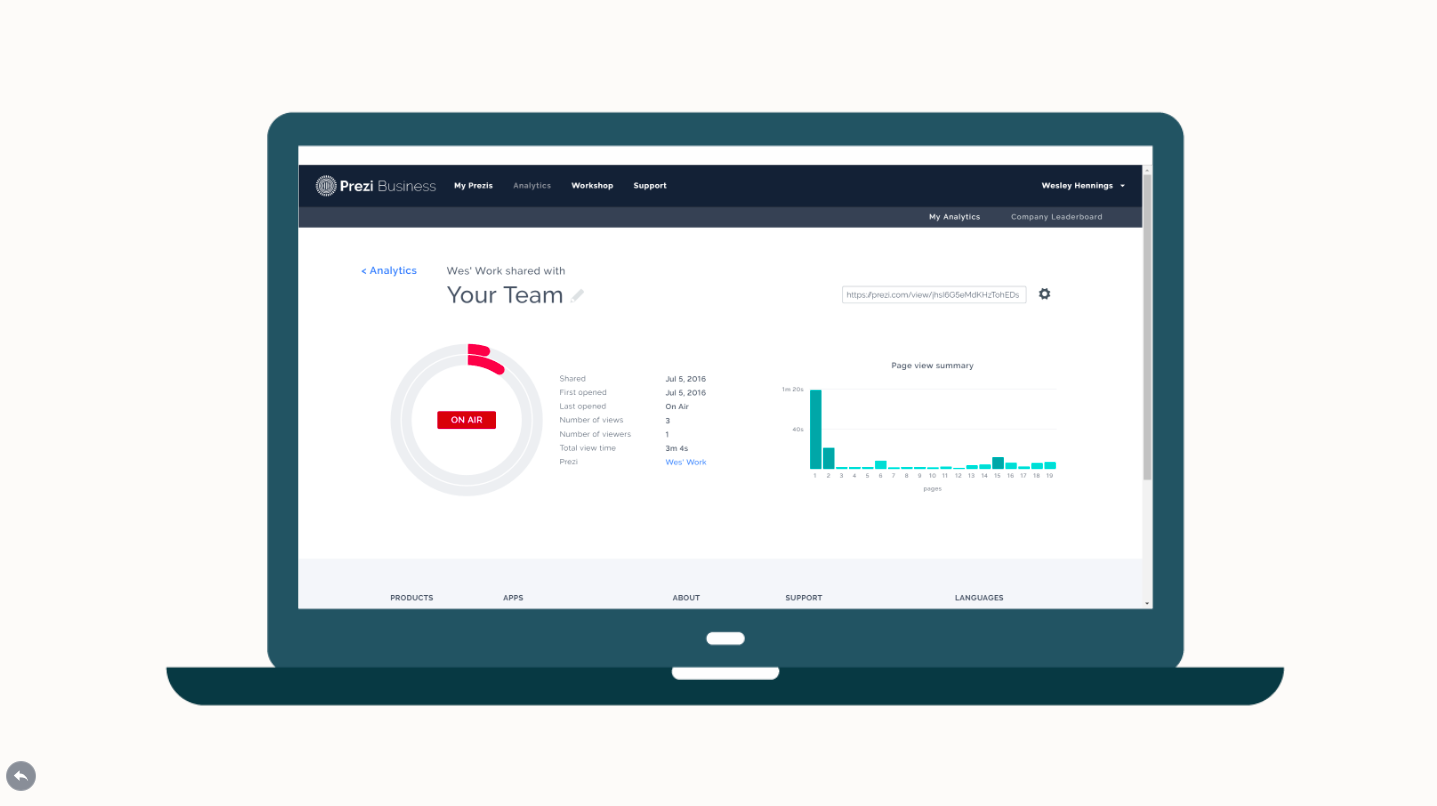
The additional perk of seeing if they shared your deck with anyone gives you a sense of how many internal stakeholders you might have to deal with down the line. You’ll be able to tell when the user is engaged and talking about you when you see your prospect sharing the deck. This will be the time to swoop in and make a follow-up call.
3. Optimize Content with A/B Testing
Try optimizing your outbound messaging by creating two tracking links (one for each presentation that you’re testing) and then send each to a large audience. Once you’ve compiled your results, you’re ready to compare the open and completion rates across the two different pieces of content. Being able to see how much time people are spending on your different pieces of content, and how they’re engaging differently, can help you understand which version of your presentation garners more engagement from your audience.

Pro tip: the fewer variables, the better. Start small, try changing one thing about your presentation and see if the amount of time people are spending on that one slide changes depending on the content.
4. Track Team Performance
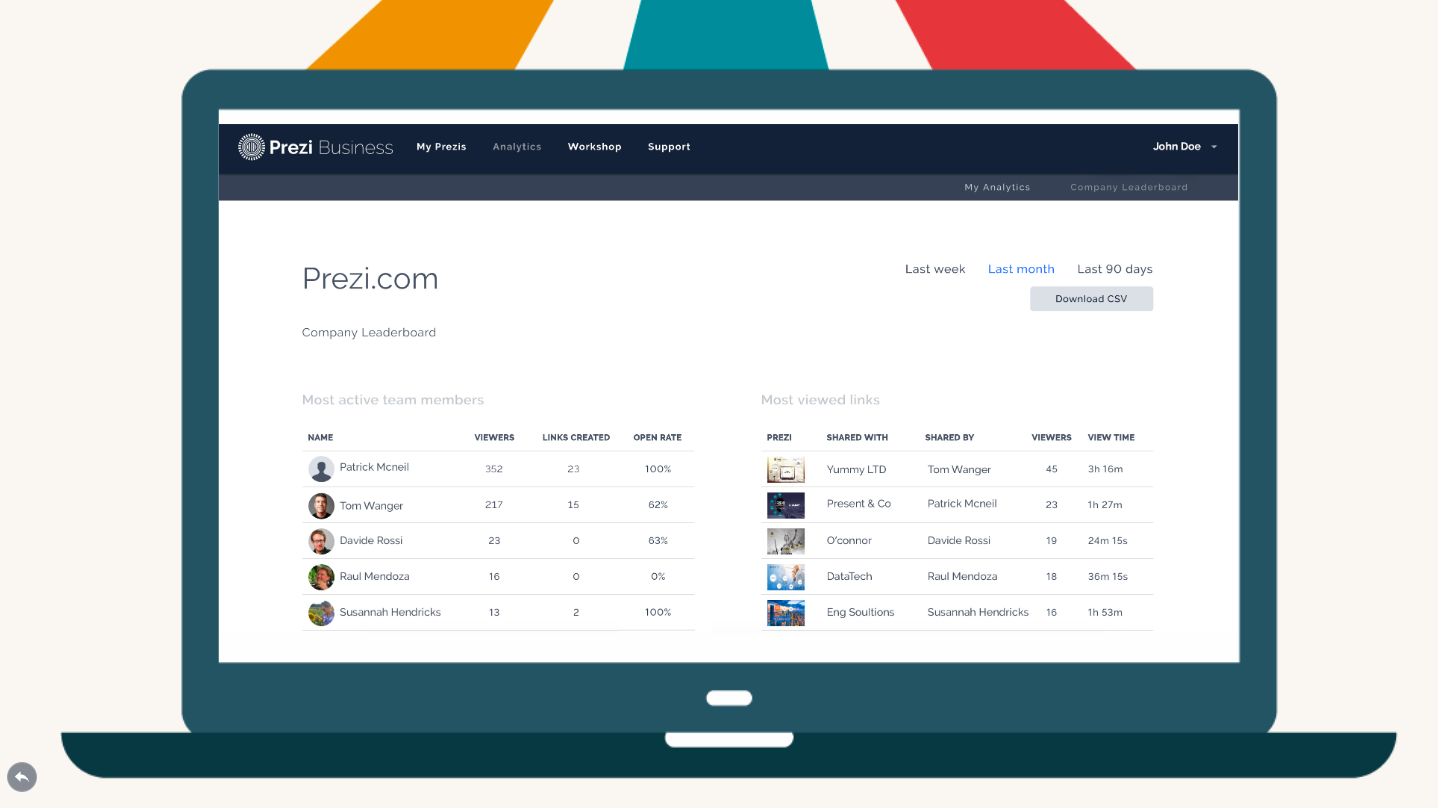
There is no “I” in team, but there is an “I” in “winner”. Use the Prezi Analytics leaderboard to track how all of your team members are performing against one another, such as who is getting the highest open rates, the highest completion rates, and the most engagement from viewers. These big picture metrics can help you to figure out who top performers are, and figure out what they’re doing differently—and how junior salespeople can become more like them.
If you’re interested in knowing more about Prezi Analytics or the other great Prezi Business features, contact us to learn more.