Chelsi Nakano
July 26, 2017
Text-heavy presentations are a bore. If you’re being presented to, all that data is hard to sit through. If you’re the presenter, you’ve spent precious time putting together something that’s hard to sit through. Bummer.
We at Prezi believe in the power of visuals. They’re easier to consume than text on a screen, and can enhance your audience’s experience in a way that’s compelling and memorable.
To add an image to your Prezi presentation:
- Go to the area where you’d like to add the image.
- Click the “Image…” icon or go to Insert > Image… from the top menu.
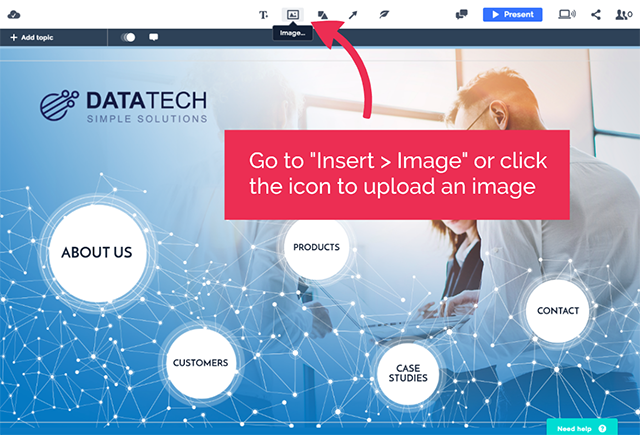
Find the image you’d like to add and click Open.
You’ll see your image appear. You can then move it, resize it, and rotate it.
To move: Click the image and drag it anywhere on the canvas. After you’ve moved it to where you would like it to be, release the mouse.
To resize: To change an image’s size, click on its box to select it, and then drag a corner to enlarge or reduce it.
To rotate: Click on the image to select it. Then hold down the ALTGr key (right ALT+CTRL) in Windows, or CMD for Mac, and drag one of the corners of the box up or down to turn it.
Bonus! When sharing your data on stage or as part of a larger story, be sure not to treat the experience like it’s a report. Follow these extra tips for delivering your data in a way that will resonate and be remembered.
1. Show it off
Don’t flip through your figures too quickly. When you pull up a chart or visual stat, leave it up and talk about it. This gives your audience a chance to let your message sink in. Explain what the chart says, then explain what it means for your audience. The longer you have your message up, the better chance you have of getting your audience to remember what you’re saying.
2. Avoid back-to-back charts
No matter how impressive the stats, too many charts can be overwhelming. Avoid sharing back-to-back charts and graphs when you present data. Instead, switch up the variety of your visuals to keep people engaged and curious.
Along that same vein, try to only show one chart at a time. The more data you display at once, the harder your audience has to work to comprehend your message, and the more distracted they will become. The last thing you want is for your audience to tune you out.
3. Use color to clarify visuals
We know you have a lot you want to share, but it doesn’t help anybody if your presentation is hard to read. Instead of jamming a ton of information into the same space, highlight one or two significant points, so people know exactly where to focus their attention right off the bat.
You can get more tips and tricks like this on our support page. Or, for more on how to design a killer presentation, check our Presentation Design 101 guide below.