Anete Ezera
September 26, 2024
Through the years, communication has grown to be more visual. Presentations that are purely spoken seem to be out of date. With tools like Prezi, we can express our ideas via immersive visual stories and pass our message in a more effective way to resonate better with the audience.
That’s why in this article, we’ll explore what is a visual presentation and the best practices for turning your ideas into visual narratives. Also, we’ll display helpful examples to get inspired by. Let’s dive right in!

What is a visual presentation?
A visual presentation is one that contains visual elements that complement the message you’re conveying. This could be incorporating images, videos, graphs or charts. The reason visual aids in presentations are so effective is because they can display information or data in a way that’s visually pleasing and help to back up the points you’re making.
There are several types of visual presentations which each serve different purposes and audiences:
- Slideshows: This is the most common form of visual presentation. It typically uses slides or frames containing images, text, and charts.
- Infographics: Infographics can display complex data in a way that’s easy to understand. They’re ideal for summerizing information and making it appear in a more engaging way.
- Interactive presentations: Interactive presentations allow the audience to play a key role. For example, they can click through different parts of the presentation or use drag-and-drop features to move elements into different positions. This type of presentation is also great for engagement.
- Data visualizations: These types of visuals are focused on numerical data, using charts, graphs, and diagrams to highlight key insights and trends.
- Videos and animations: These elements are often used to make difficult concepts easier to understand through elements like motion graphics or storytelling.
The importance of visuals in presentations
Visuals are a powerful component of any presentation, greatly enhancing the delivery of information. According to research by Prezi, the human brain processes visuals 60,000 times faster than text. The study also found that presentations with images, charts and other graphics are 43% more likely to be persuasive than those relying solely on text.
Beyond just conveying information, visual presentations help keep the audience engaged and improve their ability to remember key points. Studies also show that using visual aids triggers multiple areas of the brain, boosting both understanding and memory retention. This is particularly beneficial for the 65% of the population who are visual learners.
Key findings include:
- People remember 80% of what they see and do, but only 20% of what they read.
- Visual presentations increase audience engagement by 40%, making them more likely to respond and act on the message.
Creating an eye catching visual presentation isn’t just about aesthetics—it’s about effectively communicating your message in a way that sticks with your audience.
Types of visual aids used in presentation
Different visual aids are used for various contents and types of presentation formats. A good selection of visual aids can make a world of difference in a presentation, from clarifying complex information, infusing an added emotional dimension, or rendering abstract ideas more concrete. So, what are visual aids? To help you understand, here are some that are widely used for presentations:
1. Images
High-quality images help explain ideas or evoke emotions, offering context or improving storytelling in a presentation. For example, in educational presentations, images of historical events or scientific concepts provide context and clarity. In business settings, images are used to evoke emotions or reinforce brand identity, such as including images of products, teams, or customer testimonials.
Example: A history teacher lecturing on World War II might use real, historical photos to drive home the topic for the students, offering them a concrete link with the events.
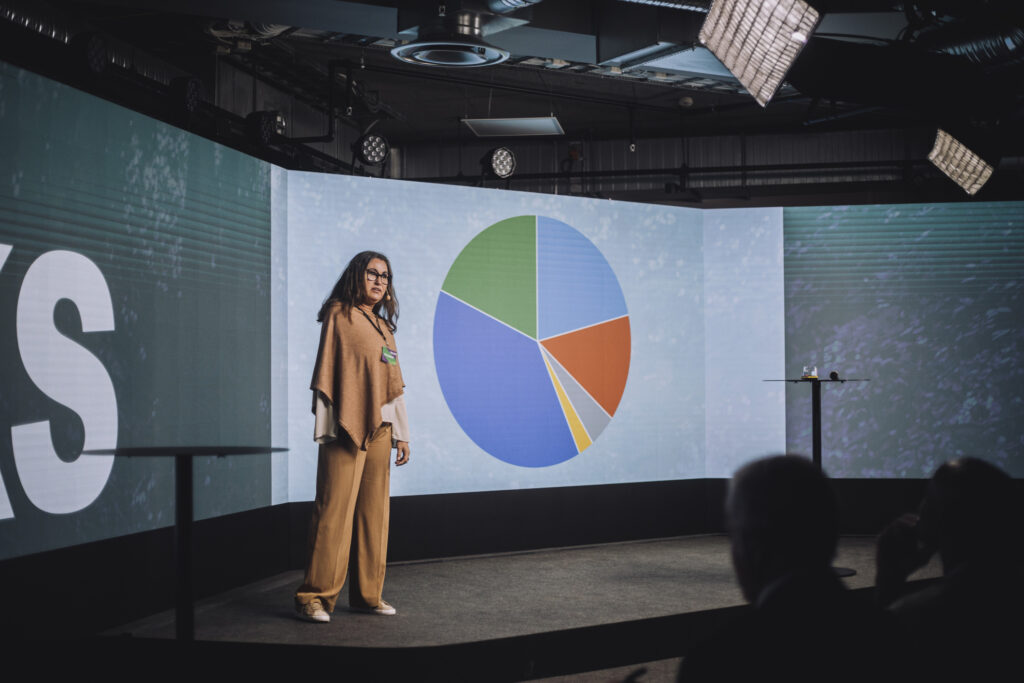
2. Graphs and charts
Graphs and charts, such as bar graphs, pie charts, or scatter plots, present data in an easily digestible format. They’re perfect for comparing statistics, showing trends, or highlighting key points. These are especially useful when presenting data-heavy topics like quarterly sales performance, project progress, or scientific findings.

Example: A business leader presenting quarterly earnings might use a bar chart to compare revenue across different departments, helping the audience quickly grasp performance differences. While in scientific presentations, scatter plots can show correlations between variables, such as age and health outcomes, making abstract data more accessible and understandable.
3. Videos and animations
Videos can be used to visually explain processes or show testimonials or real-world applications. On the other hand, animations can be used to help explain complex processes or illustrate abstract concepts. This form of visual aid is very effective in training, product demos, and educational set-ups.
Example: In a corporate training session on new software, the program may be well illustrated by a short video that shows how to use it effectively, providing the participants with an enhanced perception of the interface. Likewise, in a medical presentation, an animated explainer video can show in visual detail a complex surgical procedure or how new medical equipment functions.
4. Infographics
Infographics are a blend of text and graphics and are found highly effective in summarizing and displaying vast amounts of data in a very presentable way. Such as overviews, comparison data or step-by-step processes. They enable the audience to read a lot of data quickly.
Example: A presenter talking about climate change may bring in an infographic to summarize and give the key statistics related to worldwide temperature increases, CO2 emissions, and effects on ecosystems. This method makes very technical data readily comprehensible at first glance, especially in statistic-heavy presentations.
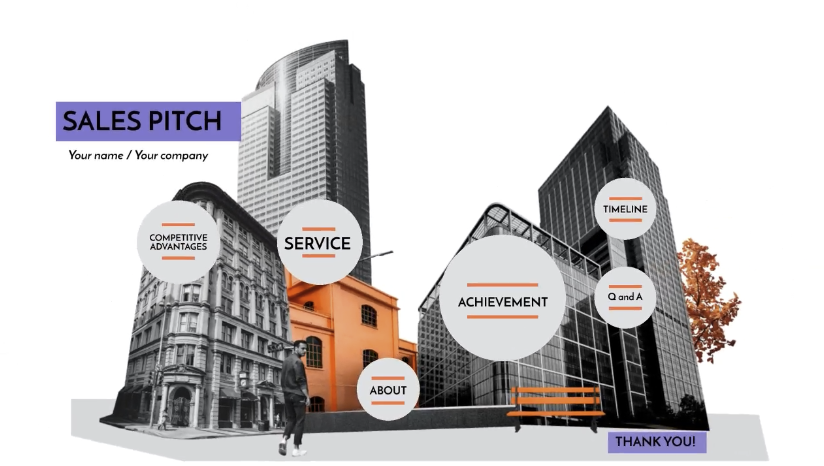
5. Text and quotes
Though text should be used sparingly for presentations, it can be used in visuals to drive home a point with some memorable quotes or key takeaways. It shouldn’t overshadow the message conveyed by the graphics or duplicate them, but provide an underscore of what’s being displayed visually.
Example: During a leadership presentation, a presenter might conclude by reiterating an inspirational quote from a well-known leader. Alternatively, during a sales pitch, a bold key statistic placed next to a product image can drive home the effect or benefits of what’s being discussed and reinforce the verbal message.

It’s important to pick the right kind of visuals for your presentation so that what you’re communicating is well received by the audience. They help simplify any complex ideas and help the message stick. From displaying data trends with graphs or using videos to enliven real-life examples, including appropriate visual components will further drive home your message during the presentation.
What is also known as a visual aid in a presentation?
There’s another common visual aid that often gets overlooked when it comes to visual presentations:
6. Props
Props are physical objects used to make content more tangible by providing a real-world example of what’s being talked about. They can help the audience follow or retain any points being made in the presentation.
Example: In a product demo presentation, a speaker might use the actual product as a prop to demonstrate its features and benefits. For example, a technology company could showcase the latest smartphone model, physically showing its unique features while explaining its capabilities. Similarly, a teacher demonstrating a science experiment could use lab equipment as props to visually support the steps of the process.
Props are particularly effective in fields such as education, product development, and sales, where tangible objects help bridge the gap between theory and practice.
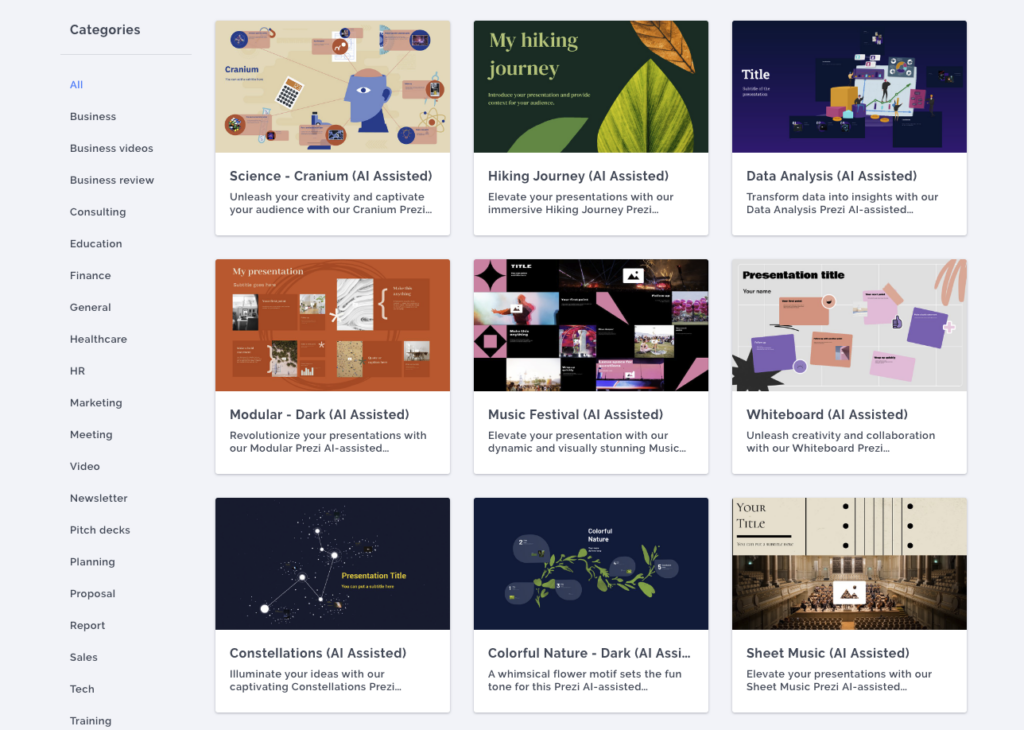
Visual presentation examples
Here are some visual presentation ideas from Prezi that demonstrate how to effectively use visuals to create engaging and memorable presentations:
1. Why Leaders Need to Get Out of Their Own Way
This visual presentation highlights leadership challenges and personal barriers that leaders often face. It uses Prezi’s zooming and panning features to focus on key points, making the content both dynamic and accessible.
2. How to Be More Productive and Focus
This visual presentation combines data visualizations and clean design to provide practical tips on improving productivity. The use of visuals helps break down time management techniques, making the content more digestible for the audience.
3. U.S. Census: Why We Do It
This visual presentation showcases the U.S. Census, explaining its purpose and importance through strong visual elements such as infographics, charts, and historical images.
4. Creative Report
A perfect example of how to present creative concepts, this visual presentation uses interactive elements and multimedia to explore the power of creativity in communication.
5. Imposter Syndrome or Incompetence
This visual presentation discusses the psychological challenges of imposter syndrome using visual storytelling. The clear layout and zoomable sections guide the audience through the topic step-by-step.
Dos and don’ts of visual presentations
Creating a successful visual presentation requires balance. Here are some essential dos and don’ts to help you design an effective and engaging visual presentation.
Do: Use high-quality visuals
Be sure to include images, graphics, and videos that are relevant to your content. A clear message should not be easily distracted by an unclear picture.
Don’t: Overload with text
Avoid cramming too much text onto your slides. Visual presentations should rely more on images and graphics, with minimal text for emphasis.
Do: Keep it simple
Visual presentations shouldn’t contain too much information. Emphasize one idea per slide or section to prevent the audience from being overwhelmed.
Don’t: Clutter slides with unnecessary visuals
Don’t use visuals just for the sake of filling space. Every visual element should serve a purpose and support your key message.
Do: Add some interactivity
Make it interesting for the audience with some clickable parts and zoomable slides which you can create in Prezi.
Don’t: Use too many animations
While animations can add flair, overusing them can make your presentation feel chaotic. Stick to purposeful animations that enhance your content.
Do: Use consistent branding
Ensure uniform branding is used throughout. Use the same fonts, colors, and design elements. It not only looks professional but also drives brand identity home.
Don’t: Ignore the flow
Ensure your presentation has a logical flow. Disorganized content, even with strong visuals, can confuse your audience.
Do: Create a story
Apply storytelling methods to walk the audience through the presentation. This makes it more personal and easier to remember.

Don’t: Forget about accessibility
Ensure your visuals and text are accessible to everyone, including those with visual impairments. Use readable fonts and provide text descriptions for important images or graphs.
How do you give a visual presentation?
A good visual presentation isn’t only about making the presentation but also delivering it effectively. Here are some concrete steps to help you through organizing, creating, and delivering a strong visual aid presentation.
The creation process: organizing your visual presentation
Start with a clear outline
Plan your content: Begin by outlining how the presentation is structured. What is the key message? What goal do you want your audience to take away? Break your content down into an introduction, some main points, and a conclusion. This will make the flow smooth and confirm that the message is clear and coherent.
Highlight key takeaways: Zero in on 2–3 main points to emphasize and structure your visuals around these key ideas.
If you want to learn more on how to effectively structure any presentation, watch the following video here:
Choose the right visuals
Select impactful visuals: The choice of visuals underlines the whole success of a visual presentation, so choose them wisely. If you’re presenting data, then graphs or charts should be applied; for emotional impact or telling stories, use strong images or videos. They should complement your spoken message without overwhelming it.
Use high-quality visuals: Images, graphs or videos should be professional and high-resolution. Low-quality visuals can detract from your presentation.
Keep it consistent: Use a consistent design theme across your presentation, including fonts, colors, and style. This creates a polished, cohesive experience.
Use storytelling techniques
Weave a narrative: Presentations are easily remembered if told as a story. Be it a business update, an explanation of a scientific concept, or a product pitch, the story must flow naturally from beginning to end. This emotionally connects the audience to what’s being presented.

Contextualize the data: Instead of just showing numbers or statistics, use storytelling to explain what the data means and why it matters. This can help engage your audience more deeply.
Leverage interactive features
Incorporate Prezi’s interactive elements: If using Prezi, make sure you take advantage of its dynamic zooming and panning by integrating as much interactivity as possible into the experience. With Prezi, you can zoom in on important details and then zoom out to see how the idea fits into the bigger picture.
Interactive visuals: Add clickable elements to your presentation to make the audience feel involved. Prezi also offers various ways to create interactive slides, keeping the audience engaged throughout.
The presenting process: delivering your visual presentation
Practice your delivery
Rehearse transitions: Practice your presentation with the visuals several times before the event. This helps ensure smooth transitions between visuals and spoken points, making the presentation feel polished and professional.
Synchronize with visuals: Make sure your verbal presentation matches the timing of your visuals. Each visual should correspond to each point being made, without taking away attention from your speech. If you’re moving from one image or graph to another, ensure that your narration coincides with these transitions.
Engage the audience
Ask questions: Encourage participation by asking open-ended questions throughout your presentation. This can help break up the content, invite discussion, and keep the audience attentive.

Use Prezi’s features for interaction: Take advantage of Prezi’s capabilities to invite the audience to explore different sections or points of interest, ensuring the presentation remains engaging.
Respond in real-time: Allow your audience to ask questions or provide feedback throughout the presentation, rather than waiting until the end. This makes the presentation feel more like a conversation and keeps energy levels high.
Maintain eye contact and body language
Confident body language: Keep your body language open and confident. Stand tall, use gestures to emphasize key points, and move around if the setting allows it. To learn more about body language, watch the following video:
Eye contact: Make frequent eye contact with your audience to establish a connection and build trust.
End with a strong conclusion
Recap key points: Finish by summarizing your key takeaways and reinforcing the most important points you’ve made. This helps the audience retain the information.
Call to action: If your presentation is designed to encourage a particular action—such as adopting a new business strategy, supporting a cause, or purchasing a product—end with a clear, actionable call to action.
Refine your content with Prezi AI
Use Prezi AI text editing: Prezi AI can offer suggestions to improve phrasing, ensuring your content is polished and refined.
AI-generated visuals: Prezi AI can suggest appropriate visuals for your presentation, guaranteeing the visual message complements that of the core content.
By breaking down the creation and presentation processes, you can deliver a strong visual presentation that effectively communicates your message, engages your audience, and leaves a lasting impression.
Leveraging Prezi for visual presentations
Prezi is a standout visual presentation tool because of its dynamic movement, interactive features, and robust AI-driven content creation. Slide-based presentations are built on the basis of one slide following another in a linear fashion; but Prezi’s format liberates presenters to zoom in and out during the presentation, which makes the journey far more interesting for the audience. From sharing complex data to telling a story, Prezi equips presenters with effective communication tools for any type of content.
Dynamic movement and zooming
A core feature that makes Prezi unique is its seamless panning and zooming within the presentation. Users can move freely between different parts of their work, which creates a far less linear, rigid structure than typical static slideshows.
For example, if you’re delivering a presentation on leadership styles, you could zoom into individual leadership types, giving the audience an in-depth look at each one, before zooming out to provide a broader comparison. This movement keeps the audience engaged, as it visually mirrors the mental shift between different sections or ideas. It’s perfect for presentations that need to show relationships between various elements or provide a top-down understanding of complex topics.
Prezi AI: Your time-saving, creative partner
Prezi AI takes the creation process to a whole new level. It not only refines your content but also helps you craft an engaging and visually stunning presentation in minutes. Here are some of the benefits of using Prezi AI:
AI-powered text editing
Prezi AI doesn’t just assist in generating content; it actively helps you refine it. Whether you need to polish your language, improve clarity, or adjust tone, the Prezi AI text editing tool provides smart suggestions to make your content more impactful.
Turning bullet points into animated slides
What makes Prezi AI unique is its capability to take basic bullet points and make them into fully dynamic and animated slides. This feature reduces the time you spend designing each slide and increases the time that can be put into refining your message. With a click, Prezi AI lays out content in visually interesting ways to keep your audience focused on what’s important. Start with a basic list of ideas and let Prezi AI convert them into an animated story that transitions smoothly from one point to the next.

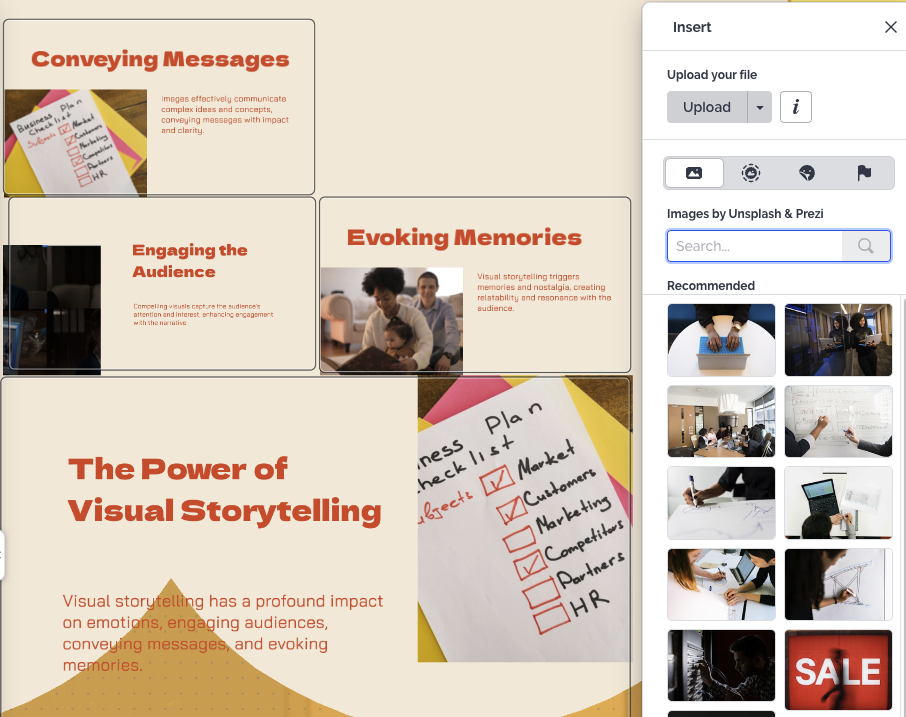
Smart content suggestions
Prezi AI has the ability to suggest appropriate visuals and layouts while taking into account what your presentation is about. For example, in a storytelling presentations, Prezi AI may bring out the visual imagery that fits into telling the story well. This not only saves time but makes the presentation uniform in appearance for easy comprehension.
Streamlining the design process
With Prezi AI, you don’t need to be a design expert to create a professional-looking presentation. The AI automatically selects color schemes, fonts, and layouts that match your content, allowing you to deliver a visually cohesive presentation. It removes the guesswork from design, ensuring that your presentation not only looks polished but also aligns with your brand or theme.
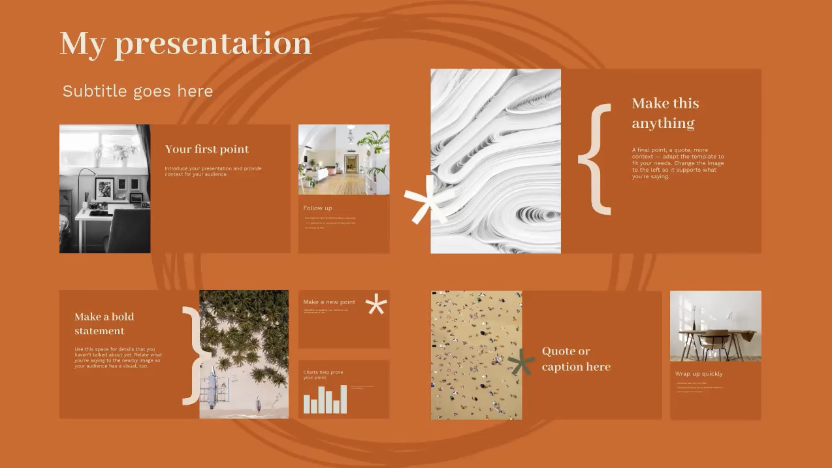
Prezi templates: Customizable and designed for impact
What makes Prezi’s templates really good is how flexible they are. Be it a presentation on leadership or one that displays data or stories, Prezi has pre-built templates for your needs.
For example, Prezi offers finance templates that make it easy to present complex numbers or trends without overwhelming your audience. On the other hand, if you’re working on a more narrative-driven presentation, Prezi’s education templates allow you to seamlessly guide your audience through a journey. And the best part? These templates aren’t static; they’re highly customizable, allowing you to tweak them to fit your brand, message, and style.
Why Prezi AI makes visual presentations easier and better
Prezi AI is more than a simple design tool—it helps you elevate your presentations without added effort. From suggesting the best visuals to refining your content with AI text editing, Prezi AI ensures your presentation is polished, engaging, and impactful.
Prezi AI simplifies the creation process by handling the heavy lifting, allowing you to focus on delivering a presentation that resonates with your audience. Whether you’re presenting complex data, explaining a detailed process, or sharing a narrative, Prezi’s AI capabilities ensure your message comes through clearly and memorably.
Use Prezi to make your next visual presentation stand out from the crowd
Creating an effective visual presentation isn’t just about adding images on slides. It’s about careful planning, choosing the right visuals, and enthralling the audience with dynamic stories. Prezi simplifies this process by offering editable templates with AI-driven features and interactivity that enlivens your presentation.
Whether it’s a data presentation, storytelling, or explaining difficult concepts, Prezi features will make your visual presentation eye-catching for the viewer. For more ideas and inspiration on creating visual presentations, explore our guide on presentation styles and enhance your presentation skills today!